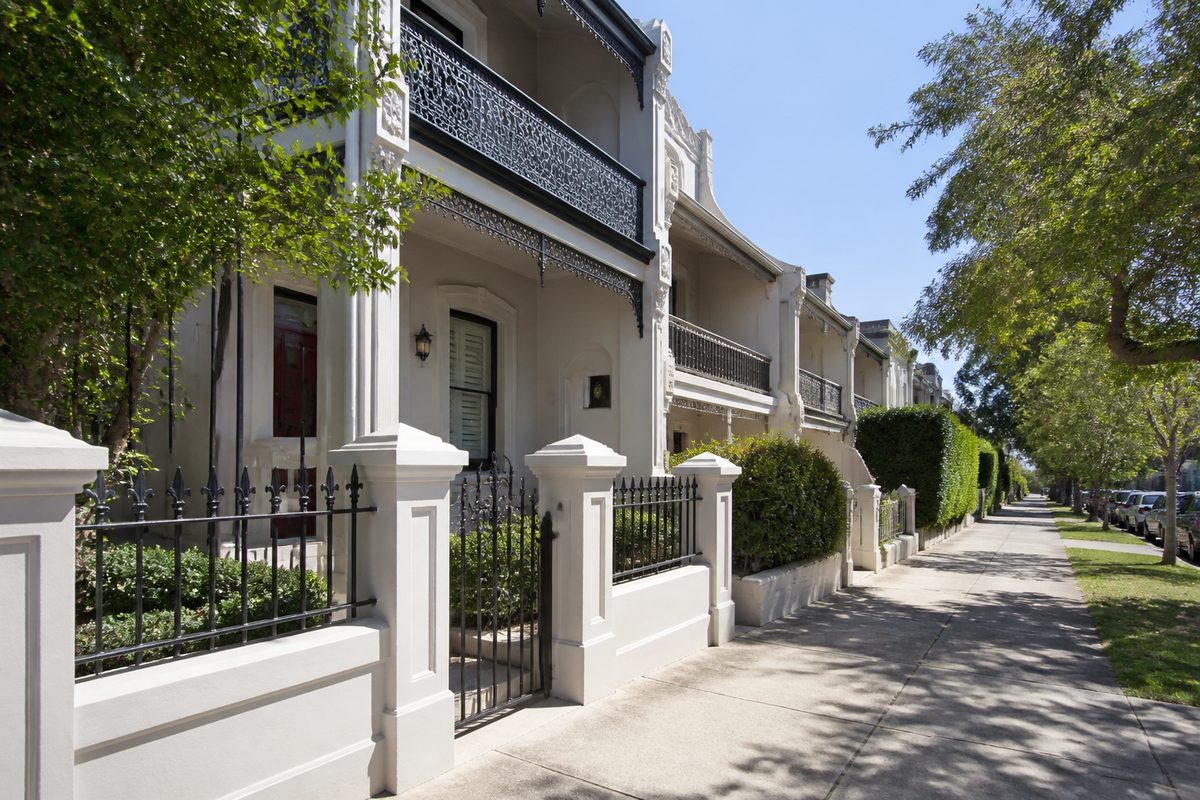
Bayswater house prices have climbed over the long term, while units have taken a less direct route because land scarcity, new supply and buyer demand affect each property type in different ways. A useful history needs to look past a single median price. It should follow completed sales, property features, market cycles and shifts in the kinds of homes sold.
This guide covers Bayswater in Western Australia, within the City of Bayswater and close to central Perth. That detail matters. Several Australian suburbs share the Bayswater name, and data from the wrong one can create a comparison that looks sound but is useless.
The core idea is simple: Bayswater's long-run price story is mostly about land. Houses tend to include more private land, while unit values rely more on building quality, strata costs, local supply and demand for that style of home. Buyers and owners who split those forces apart can read the market with much more care.
What does the price history really show?
Bayswater changed from a fairly affordable inner-eastern suburb into a more sought-after part of metropolitan Perth. Its spot near jobs, established services and transport helped fuel demand as Perth grew. Older homes on useful blocks also drew buyers who saw room to renovate or redevelop.
Prices didn't climb in a straight line. Bursts of strong growth were broken by slower markets and falls in some segments. Perth's wider economic cycle mattered greatly, as credit conditions, job confidence and migration shaped how many people could buy and how fiercely they competed.
The early and mid-2000s brought a sharp upswing across much of Perth. Fast economic growth and confidence tied to Western Australia's resources economy lifted housing demand. Bayswater gained because it offered established homes within easy reach of central Perth.
After the global financial crisis, conditions became patchier. Later, the end of the mining investment boom hurt confidence and eased housing pressure across Perth. Some Bayswater properties held up better than others, with well-placed houses on useful land often drawing more buyers than small units in projects packed with similar stock.
The market shifted again during the pandemic period. Low borrowing costs, government support, limited stock and stronger demand for space pulled buyers toward established homes. Interest rate rises later cut borrowing power, yet low listing numbers and renewed population growth supported prices in many Perth suburbs. That's why higher rates don't always lead to lower prices.
Why have houses and units performed differently?
A house sale often passes over two assets at once: the dwelling and a large share of land. Buildings age. They need work, while scarce land in an established suburb can gain value as the metropolitan area expands.
A single-family detached home also gives its owner more control. Within planning rules, the owner may renovate, extend or rebuild without going through a strata group. That freedom has value, especially when buyers want a yard, parking or room for a family's changing needs.
Units behave differently. Their prices depend on internal size, build quality, strata finances and competition from similar homes. A well-designed villa with private outdoor space may act more like a small house, while a compact apartment in a large complex may compete against many near-identical listings.
New construction can hold back unit price growth too. When developers add similar stock faster than demand grows, existing owners face more competition. House supply is tougher to expand because suitable land is limited. Blocks can sometimes be divided, but subdivision doesn't create more land overall.
In my experience reviewing suburb data, the biggest mistake is treating every property labelled “unit” as the same product. That tag may cover an apartment, villa or townhouse. A ground-floor villa in a small group can attract a very different buyer from a one-bedroom apartment with a lift and high shared costs.
Can the suburb median tell you what a property is worth?
No. A median is the middle result among properties sold within a set period. It doesn't set the price of one home.
Say more renovated houses sell this year, while more basic homes sold last year. The median could rise even if each unchanged property barely moved in value. The reverse can happen when several smaller dwellings sell in one quarter.
Low sales volumes make this mix effect stronger. Just a few unusual deals can shift a quarterly unit median. House sales often provide a bigger sample, but block size, condition and development potential can still skew the results.
A sound historical review should compare several measures:
- Annual medians instead of relying on one month or quarter.
- The number of completed sales behind each result.
- Prices for similar property types and land sizes.
- Repeat sales of the same address where meaningful improvements can be identified.
- Price per square metre of land for suitable house comparisons.
Median data works best as a broad market signal. comparable sales handle the harder job of working out value.
How should past sales be compared?
Start with settled sales from a tight area and a useful time window. Recent evidence usually deserves more weight. But an older sale may still help when the property closely matches the subject home and you can estimate market movement since settlement.
Match the features buyers pay for. For a house, compare land area, street position, dwelling condition, parking and usable indoor space. Check zoning and subdivision potential as well, since two blocks that look alike may offer very different options.
For a unit, compare the dwelling style, internal area, outdoor space, parking, building age and strata fees. Read the strata records when they're available. A low sale price may point to major planned work, poor upkeep or restrictions hidden from listing photos.
A proper real estate appraisal then allows for meaningful differences. It doesn't start with the suburb median and add a fixed sum for each bedroom. Buyers judge the property as a whole, and its features work together. An extra bedroom with no useful living area may add less than expected.
I've found that failed comparisons often start with the wrong question. Owners ask what another three-bedroom property fetched but overlook its larger corner block. Remove the land and planning difference, and the apparent bargain or premium often vanishes.
Which forces moved Bayswater prices through each cycle?
Borrowing power
The interest rate changes how much many buyers can borrow and the repayments they must cover. Falling rates can lift bidding power. Rising rates cut it, especially for investors and buyers close to their lending limit.
But rates are only one force. If listings fall at the same time, buyers may still fight over a small pool of suitable homes. That's why claims that prices must drop whenever rates rise often fall apart.
Available stock
Supply and demand play out within each property segment. Ten buyers chasing detached homes don't create the same pressure for small apartments. The number of real alternatives matters more than the total number of properties listed under the suburb's name.
Supply also moves slowly. A house can be listed fast, but a new development may take years to plan and build. By the time its units hit the market, finance costs or buyer tastes may have shifted.
Household formation and migration
Population growth supports housing demand when new residents form households and can afford local homes. Still, the effect isn't automatic. Household size, age and income shape the homes people seek. More renters may affect vacancies and rents first, while stronger owner-occupier demand may flow straight into sale prices.
Planning and land use
Changes to zoning or development rules can shift what buyers will pay for land. Yet possible development on paper isn't the same as a profitable project. Demolition costs, building prices, site shape and approval limits all shape whether it will work.
A block shouldn't get a development premium just because an online map hints that it could be divided. Buyers need to check the current rules and real-world costs before paying extra for that option.
What can auction results reveal?
An auction may reveal strong competition when several prepared bidders want the same property. It can also uncover weak demand when bidding falls short of the seller's reserve. Either way, the result covers one property on one day.
Perth has often used private-treaty sales more heavily than markets where auctions rule. So Bayswater auction clearance figures aren't very useful when the sample is small. The final sale price, contract terms and number of serious bidders give more context than the auction label alone.
Don't assume a passed-in property has no demand. It may sell soon after through negotiation. And don't assume one huge result resets every nearby value, as the property may have rare land, an exceptional renovation or a feature that nearby homes lack.
How is long-term capital growth measured properly?
Capital gain is the gap between the purchase price and the later sale price before all ownership and selling costs are counted. It isn't the owner's true profit.
A property bought for $500,000 and sold for $750,000 has a gross gain of $250,000. The owner may also have paid stamp duty, loan interest, maintenance, insurance, rates, strata charges and selling fees. Renovation spending needs to be kept separate from market growth because the owner paid for part of the higher value through those improvements.
Time matters just as much as the dollar gain. A $200,000 rise over four years isn't the same as that rise over fifteen years. An annualised growth rate makes the comparison fairer:
Annual growth rate = (sale price divided by purchase price) raised to the power of one divided by years held, minus one.
For a clearer picture of ownership, record major costs and rental income on their own. Tax treatment depends on the owner's situation, so a property price history shouldn't be treated as personal tax advice.
Where should reliable historical evidence come from?
Use settled sale records as your base. Landgate records matter because they show legal property transactions in Western Australia. Real Estate Institute of Western Australia data can shed light on suburb trends and market conditions, while Australian Bureau of Statistics material adds context on lending, building activity and population change.
Property portals are useful for listing history, photos and advertised features. Check their estimates against settled sales. An automated estimate can miss internal condition, development limits or a strata problem.
Check the date tied to every figure. The sale date, settlement date and publication date may not match. Also make sure a reported number covers the suburb, postcode, local government area or another boundary. Mixing them creates false trends.
Historical ads need care because the advertised price isn't always what the buyer paid. “Offers above” and price guides show a sales strategy. They don't replace the final transaction.
How can buyers use the history without overpaying?
Define the exact property segment first. Someone seeking an older detached house shouldn't use apartment results to guide an offer. Build a short list of settled comparable sales, then allow for differences in land, condition and position.
Now check the current competition. Historical growth may explain why Bayswater costs more than it once did, but it doesn't prove that any asking price is fair. Count the realistic alternatives and note how long comparable homes stay available.
Inspect the physical asset with future bills in mind. Older homes may need drainage, roofing or electrical work. Units can bring special levies and shared upkeep. A cheap purchase can quickly lose its shine when delayed costs surface.
Set your limit before talks begin. It should reflect the property's value to you and the sales evidence, not the seller's purchase price or hoped-for gain.
How can owners judge the best time to sell?
Owners should watch the depth of demand in their own segment. Strong suburb headlines mean little if similar units sit unsold or several rival houses are about to hit the market.
Ask local agents for evidence, then check every claim against completed sales. Request the addresses used in the appraisal and ask why each property is a fair match. A high suggested price may win an owner's listing but weaken the campaign if buyers reject it.
Presentation should fit the likely buyer. Fix clear faults and make every room easy to understand. Big renovations done only for the sale may not recover their cost, especially when buyers plan to change the home themselves.
The sale method should follow the evidence. Auction may suit a scarce property with several likely bidders. Private treaty may be better when buyers need time to compare features or the property's value sits within a clear range.
What should you do with the historical data?
Create a one-page property record before making a decision:
- Confirm the property type, land component and planning controls.
- Collect five to ten relevant settled sales from the same local pocket.
- Separate market growth from renovations and changes in the sales mix.
- Compare annual results across a full cycle instead of choosing one peak or low point.
- Check current listings to measure immediate competition.
- Calculate ownership costs before treating a gross gain as profit.
This process turns suburb history into a useful decision tool. It also stops Bayswater's strong long-run story from being used to excuse a poor individual purchase.
Before you buy, sell or refinance, compare the property with settled sales from the same Bayswater housing segment rather than relying on the suburb median.
Historical house and unit prices in Bayswater, Western Australia reflect changing demand, property types, and broader market conditions, helping buyers and sellers understand how the local property market has evolved over time.